Network · how to
How to See What Data a Website Sends
Use Chrome or Edge DevTools to see what data a website sends. Real screenshots explain file uploads, request payloads, and form data sent before submission.
Quick answer
Open the Network panel before reloading a page, keep All request types visible, and perform one action with invented data. Select the requests that follow and inspect their URLs, request headers, payloads, and any connection messages to identify what was sent and where.
A website can send data when you open a page, type into a field, select a file, submit a form, or leave. The browser's Network panel lets you inspect what it sends, where it goes, and which action triggered the request.
This walkthrough uses Chrome and Edge on a desktop. You will record a page load, perform an action with invented data, and inspect the outgoing requests. You do not need to write code or paste commands into the Console.
We welcome the same checks of LeetTools. The LeetTools example at the end gives you a procedure to test our local-processing commitment.
The screenshots show a local demonstration captured in Chrome for Testing 148.0.7778.96 on October 15, 2026. Both receiving servers run on the same computer, and every email and file is invented. Follow along on the site you want to check; you do not need to run the demonstration. Each screenshot has a full-size link.
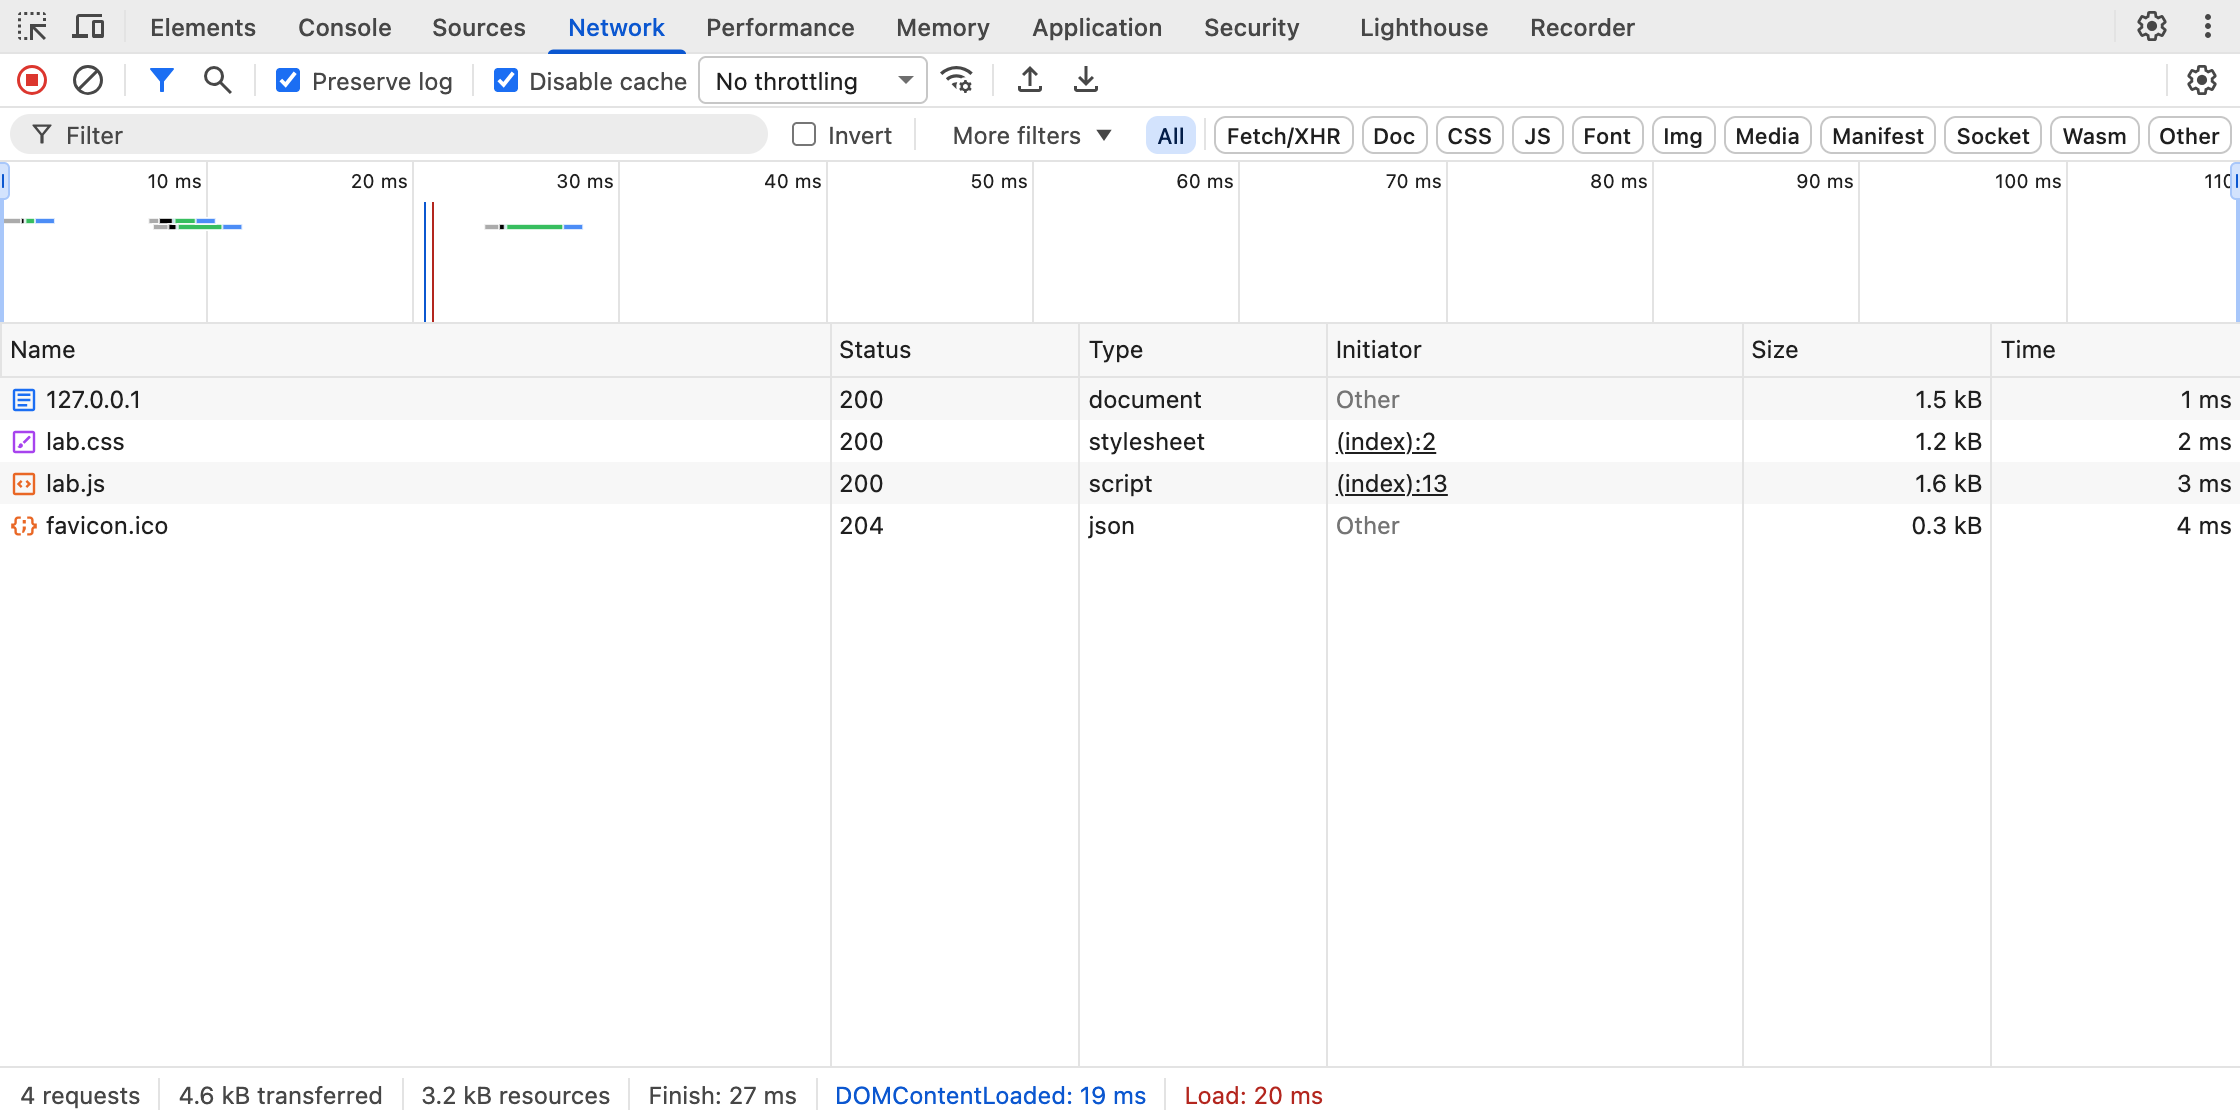
Open the Network panel before you begin
Open the page you want to examine. Press Ctrl+Shift+I on Windows or Linux, or Command+Option+I on macOS, and select Network. If the panel is hidden, look in the tab overflow menu.
Check these controls:
- Recording is active; the recording button should show its active state.
- All request types are selected and the filter box is empty.
- Preserve log is enabled, so navigation will not erase the captured requests.
- Disable cache is enabled while DevTools is open, making resource requests easier to observe on reload.
Now reload the page. You should see request rows appear. An empty log from before you opened DevTools tells you nothing about earlier activity. Chrome's Network tutorial and Microsoft's Edge walkthrough describe the interface if you need help finding a control.
 Open Full Size
Use a clean browser profile when possible, and note any extensions or blockers. A blocker may suppress requests you would otherwise observe. The panel inspects the selected tab, not every application on your device.
Learn which destinations the page contacts
Right-click a request-table column heading and enable Domain. Hover over a request name or select it to see the full URL.
Record the page-load baseline before interacting. Look for the site's own domain, asset hosts, analytics services, advertising hosts, and any other destinations. These labels are starting points: a third-party script download does not by itself show that form contents were uploaded, and an endpoint on the site's own domain can still receive sensitive data.
A request name such as collect, events, or upload can help you decide where to look first. It does not establish what the request carries. Inspect its details.
Record one action with recognizable test data
Use invented information rather than a real credential or confidential document. Choose a marker you can recognize, such as audit_probe_K4M8, and replace the suffix with one of your own.
For an email field, use [email protected]. For a text tool, enter a sentence containing the marker. For a file tool, use a harmless file in a format it accepts, with the marker in its name and, where possible, its contents.
Watch the log through the whole interaction:
- Type or select the sample, then pause before pressing any button.
- Move focus to another field and check for new requests.
- Submit, convert, search, or perform the action you are testing.
- Wait for delayed traffic; 30 seconds is a useful initial observation window, not a guaranteed maximum delay.
- Navigate to another page in the same tab with Preserve log still enabled, then check the final requests.
Separating these actions lets you distinguish data sent while typing from data sent on submission or departure. Note the timing or take a screenshot at each stage. Keep the original log, including connections established during page load; an existing connection may carry new data without adding another request row.
Read the outgoing request details
Now select a request made around the action you recorded. Start with Headers, then examine Payload when available.
| Detail | What it can reveal |
|---|---|
| Request URL | Destination, path, and values embedded in query parameters |
| Request Method | How the request is made; GET and POST can both carry data |
| Request Headers | Cookies, authorization values, referrer, and other metadata |
| Payload | Query parameters, form fields, JSON, or uploaded file data |
| Initiator | The code or page action that started the request |
Request details describe what the browser sends. Response and Preview describe what comes back. Finding your marker in outgoing data is evidence of transmission; finding text in a downloaded page alone is not.
GET requests deserve the same attention as POST requests. A URL such as https://example.com/search?q=audit_probe_K4M8 sends the marker in its query string even without a request body. Request headers can also send session cookies or authentication data when no form value is present.
An HTTP success status shows that the destination responded, not that the data was appropriate to send. A failed or blocked row may still indicate an attempted transfer; record its status instead of claiming the destination received it.
Example: form data sent before you submit
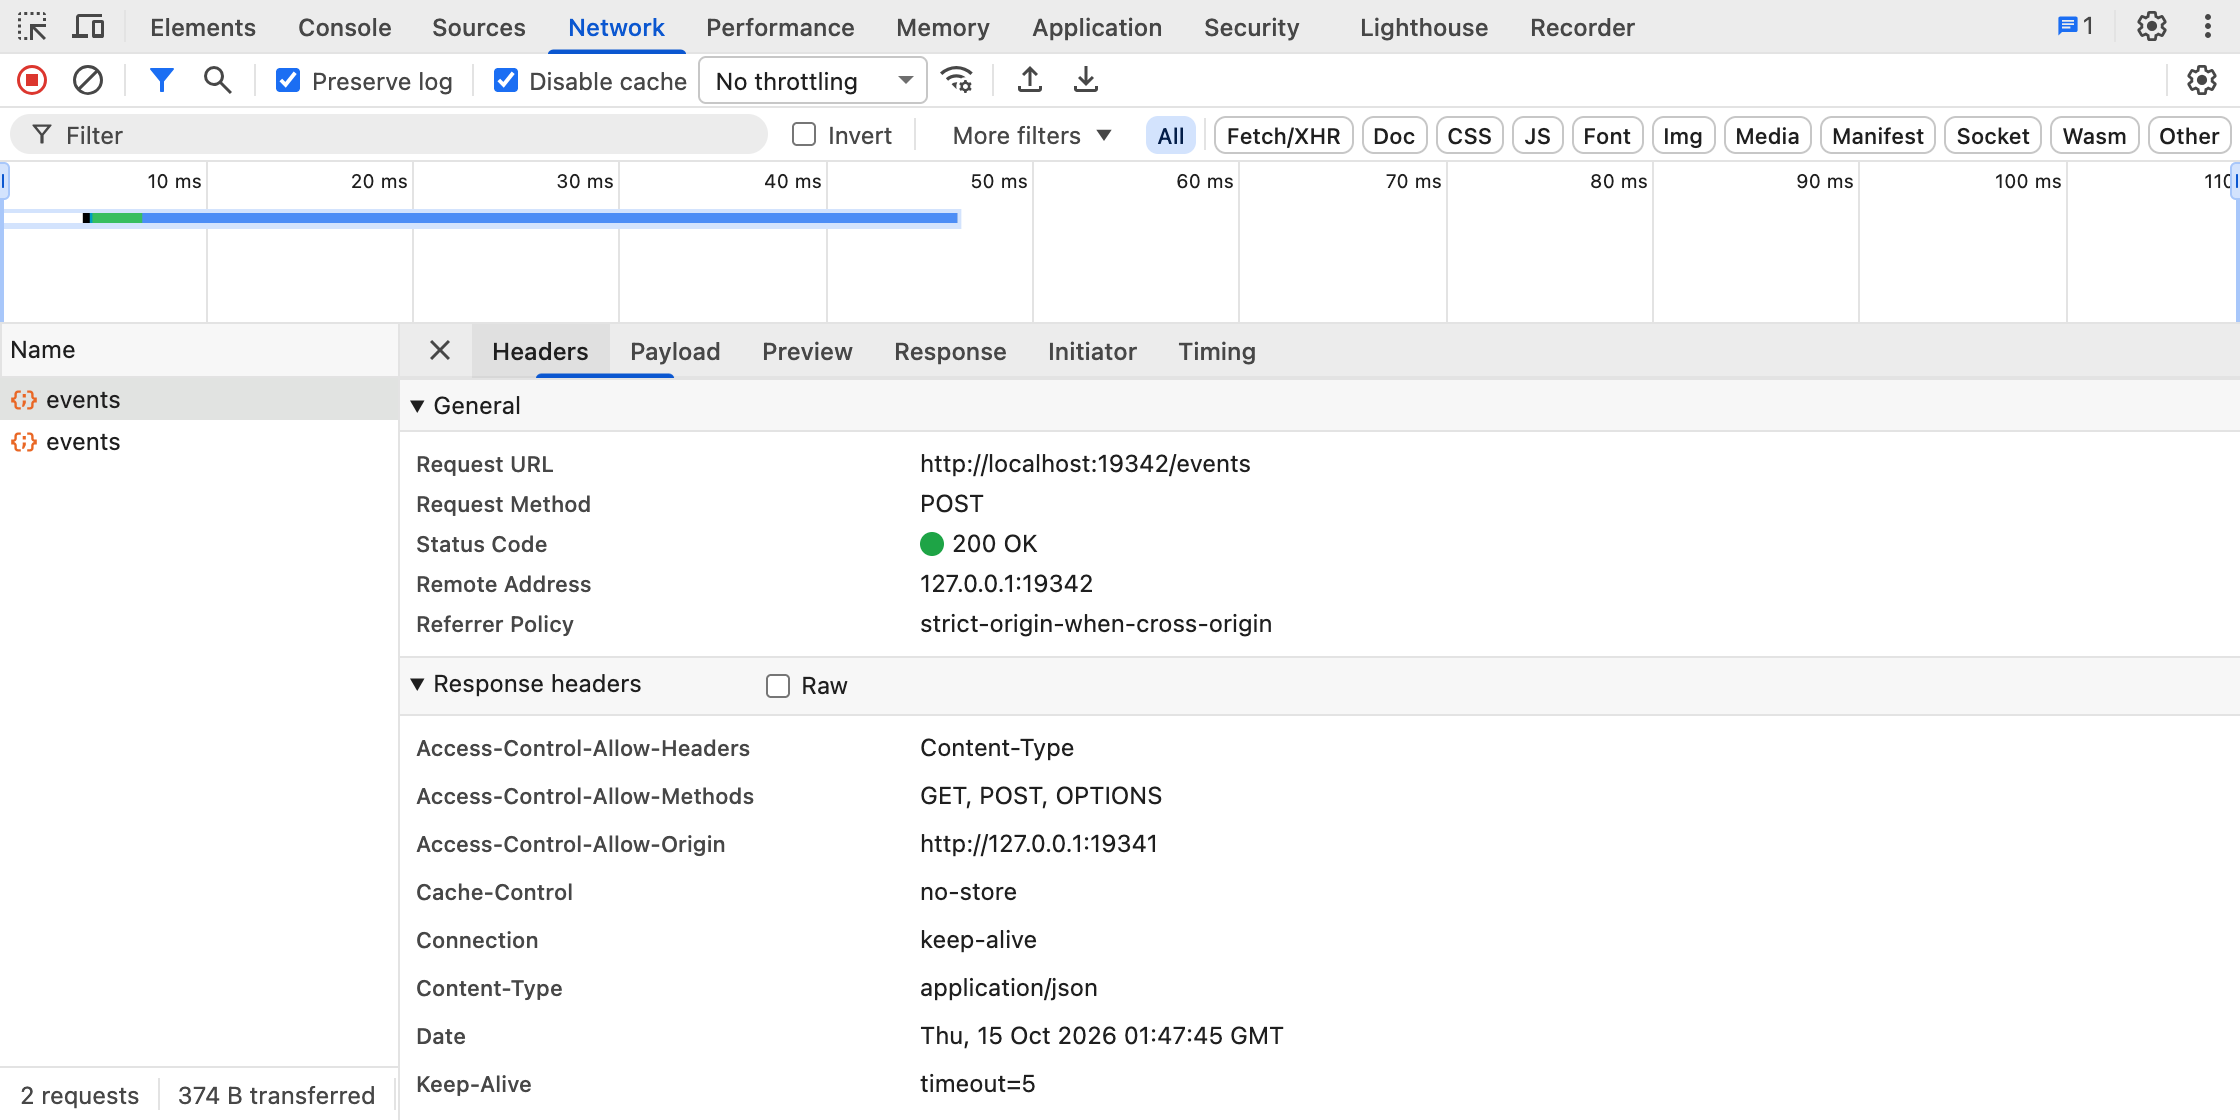
In our local demonstration, changing the email field triggered a request before Submit sample was pressed. Its Headers tab shows a POST to http://localhost:19342/events:
 Open Full Size
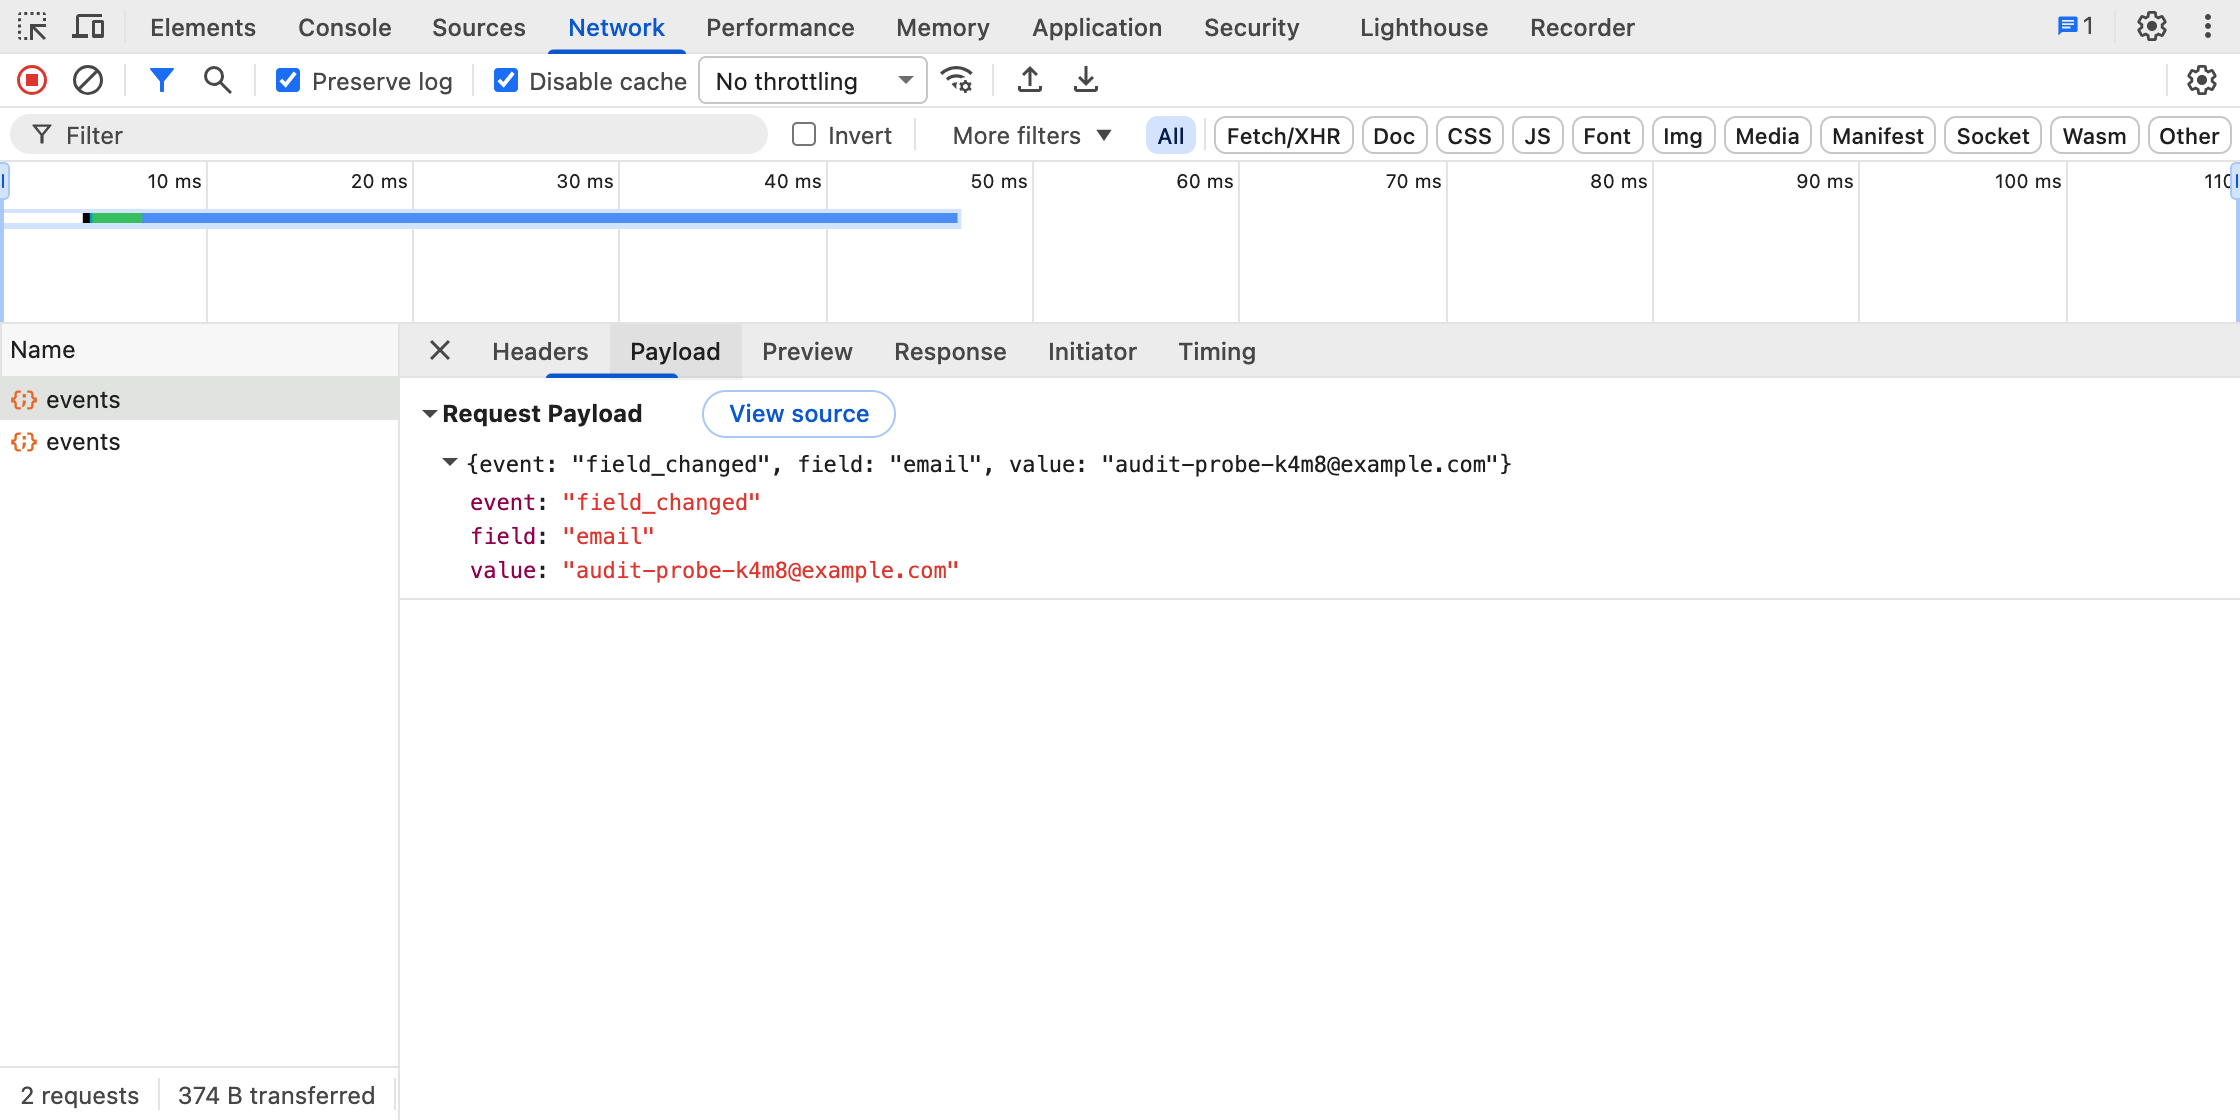
The Payload tab shows the JSON body:
{
  "event": "field_changed",
  "field": "email",
  "value": "[email protected]"
}
 Open Full Size
The receiver recorded the same JSON body before the form was submitted, confirming that this example sent the email early. An event containing only "event": "button_clicked" would not show transmission of the email. Read the fields rather than judging a request by its name.
You may also see an events row with type preflight and status 204. That is the browser's OPTIONS check for the cross-origin request, separate from the POST containing the email. Compare their methods and payloads.
Check whether a website uploads your file
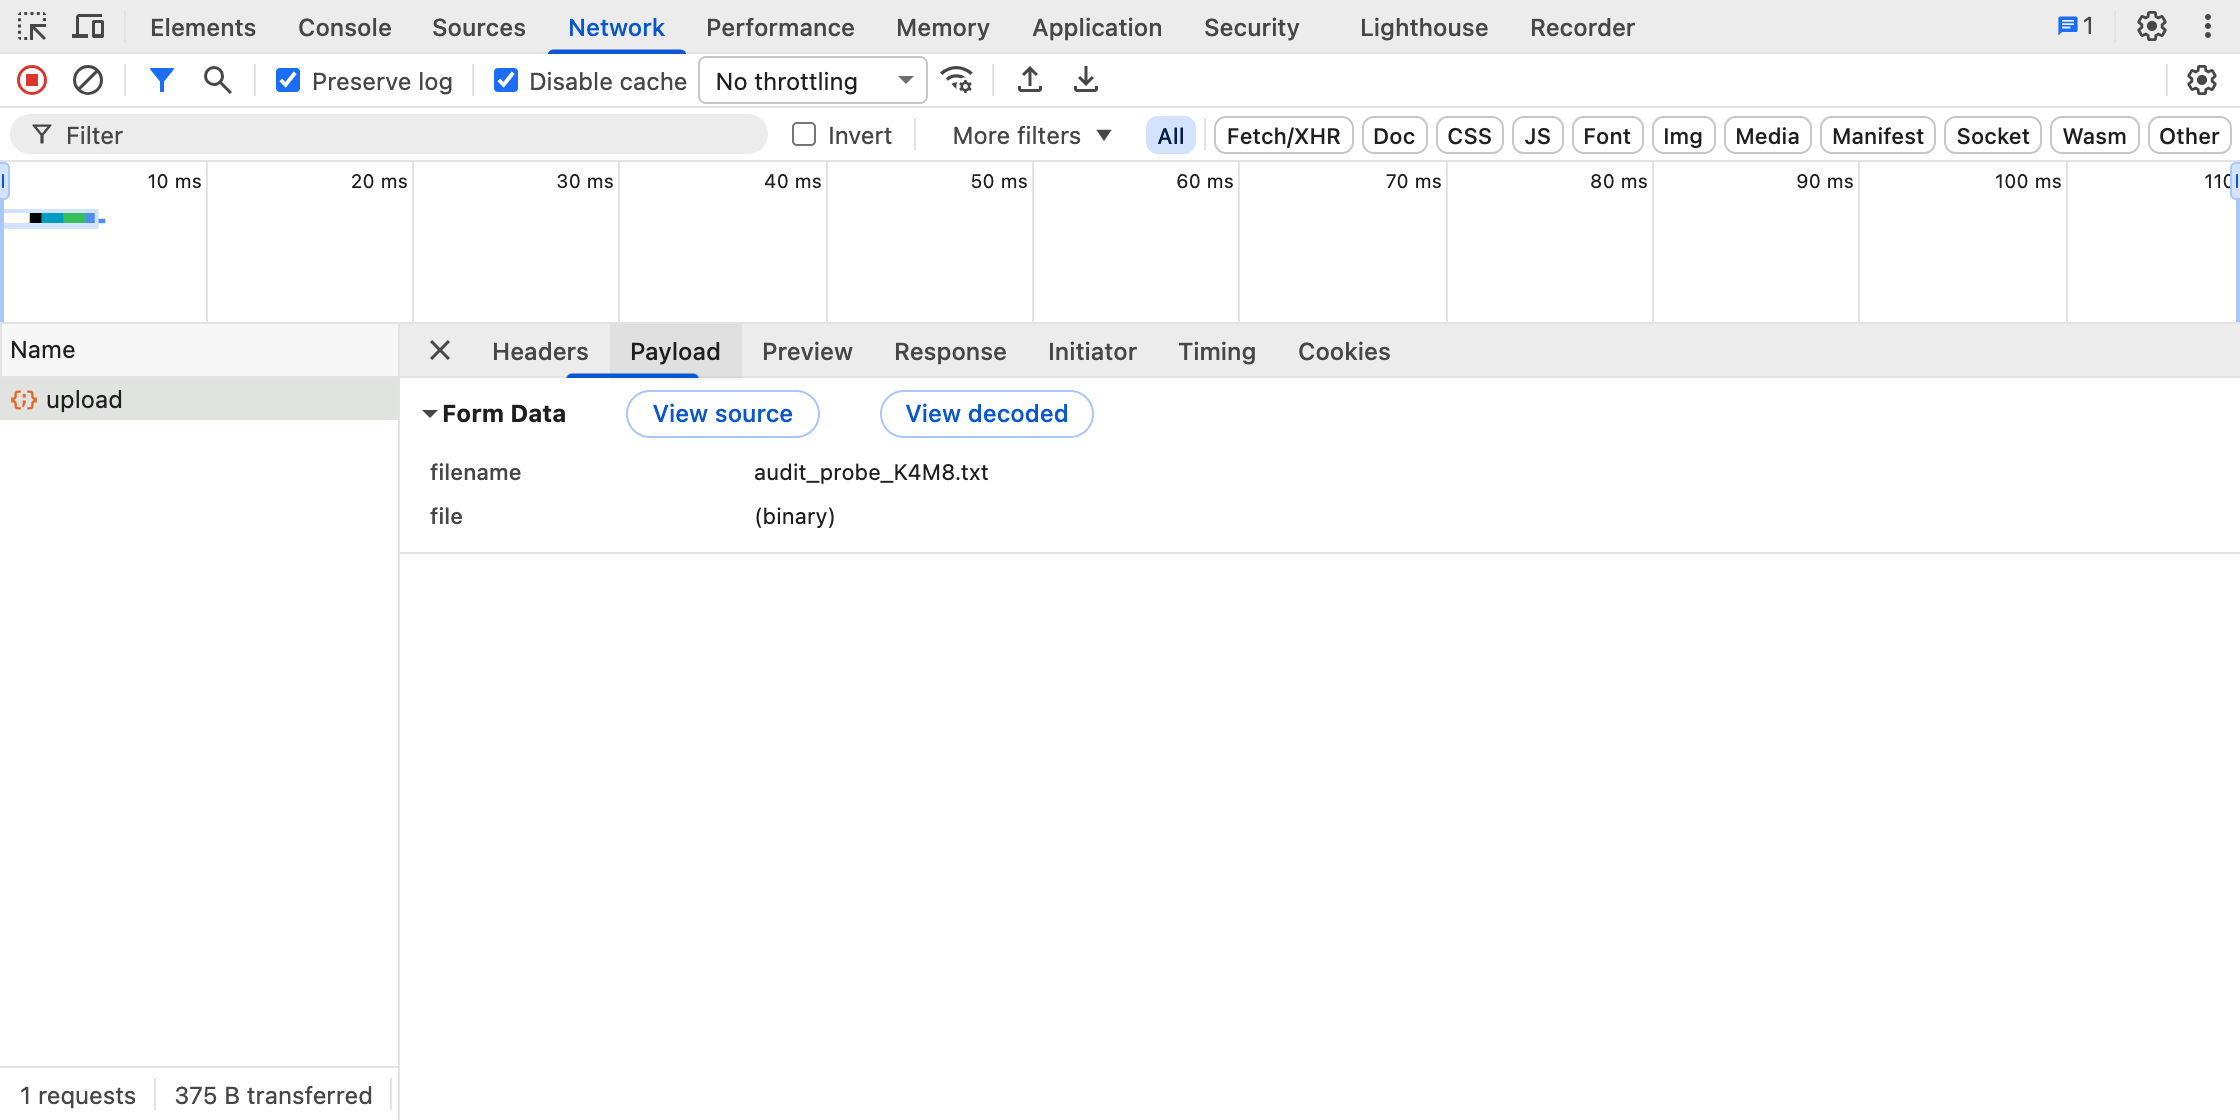
For a file submission, look for multipart/form-data, a filename, a file part, or a binary request body. A readable marker can identify a text-file upload, but an image, compressed file, or transformed payload may not expose that marker as plain text. Treat filenames, contents, and derived metadata such as dimensions as separate findings.
 Open Full Size
Here, the receiver confirmed that the file part contained the sample text. A filename alone would establish only that its name was sent. Do not infer an entire document was uploaded just because its name appears in a request or response.
If a file preview or download uses a blob: URL, the browser is referencing locally held data. That URL alone is not an HTTPS upload; MDN explains blob URLs. Check the other requests before concluding that the file was never sent elsewhere.
Optional: repeat a local-processing task offline
If a tool claims to compute locally, first complete a task with a dummy file so its processing resources can load. Switch Network throttling to Offline and repeat with a different sample without reloading. Success supports local computation for that operation. Reconnect and keep recording to check for queued traffic: offline success alone does not establish that the input was never transmitted.
Inspect cookies and WebSocket messages
For cookies, inspect the request's Cookies view and request headers. A cookie can identify an existing session or browser even when the request does not include your typed sample. You can record the cookie name and purpose of the request without copying the live value into a report.
For WebSockets, select the connection and examine Messages for outgoing data. Start from All: looking only at Fetch/XHR can hide other transfer mechanisms. Chrome's Network reference covers payload, cookie, and connection inspection.
Use the panel's search to help locate your marker in the captured requests. A missing search result does not settle the question: inspect the relevant payloads and connection messages yourself, particularly for binary, transformed, or encoded data. Record an unreadable body as unresolved, not as containing no personal data.
Compare requests before and after a privacy choice
If the site offers analytics, advertising, or other privacy choices, make one change at a time and repeat the same sequence with a fresh marker. Save both captures and compare destinations and outgoing fields, not just the number of rows.
In the same demonstration, Optional measurement enabled controls the additional events requests. With it enabled, changing the email field sends field_changed, submitting sends the required submit request, and a second measurement event records submission:
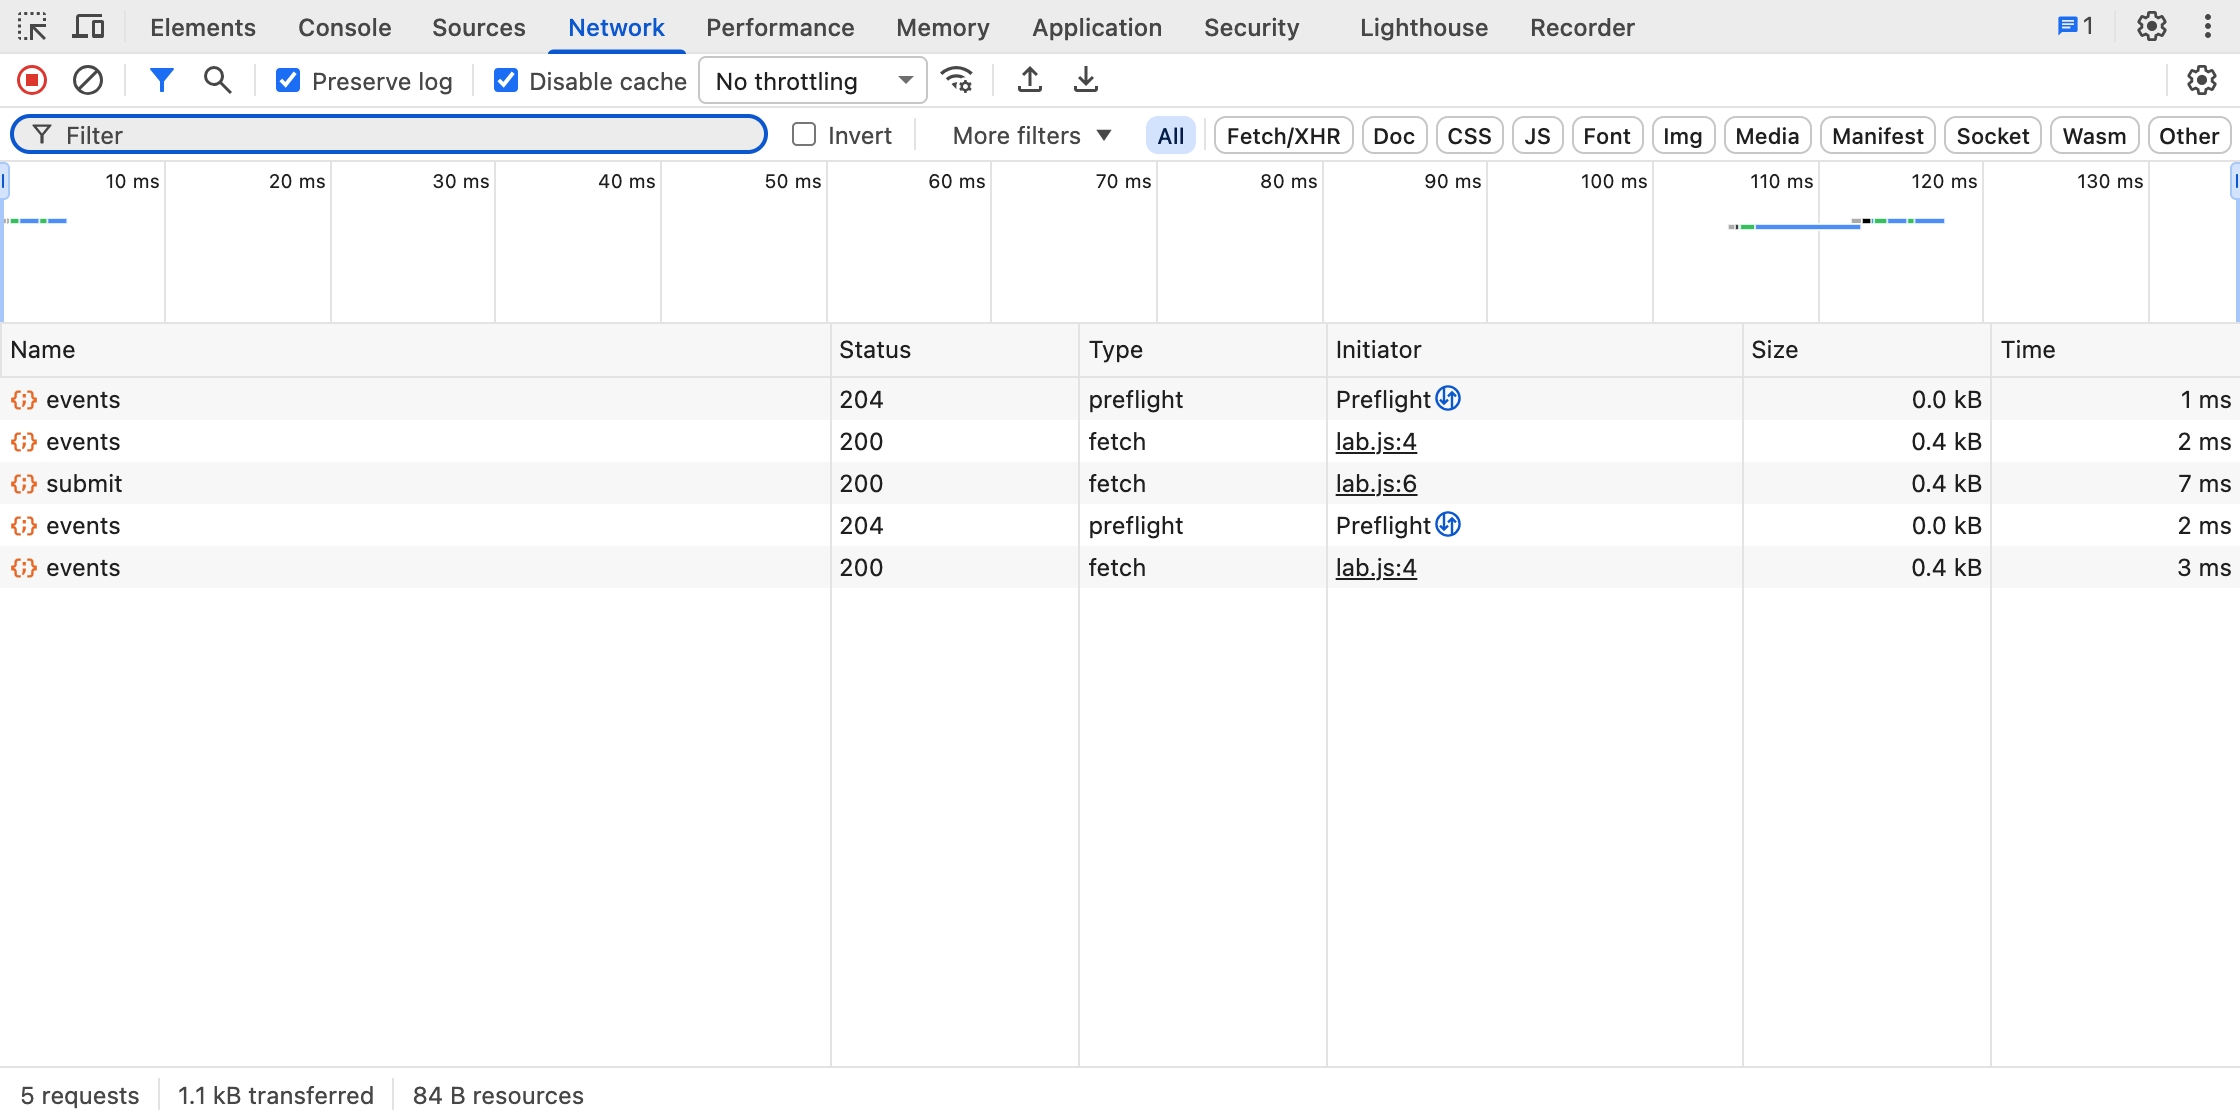 Open Full Size
After turning the switch off, we repeated the form interaction with a fresh dummy address. The form still submitted successfully. The local receiver recorded one submit POST and no measurement POST during the 30-second observation window:
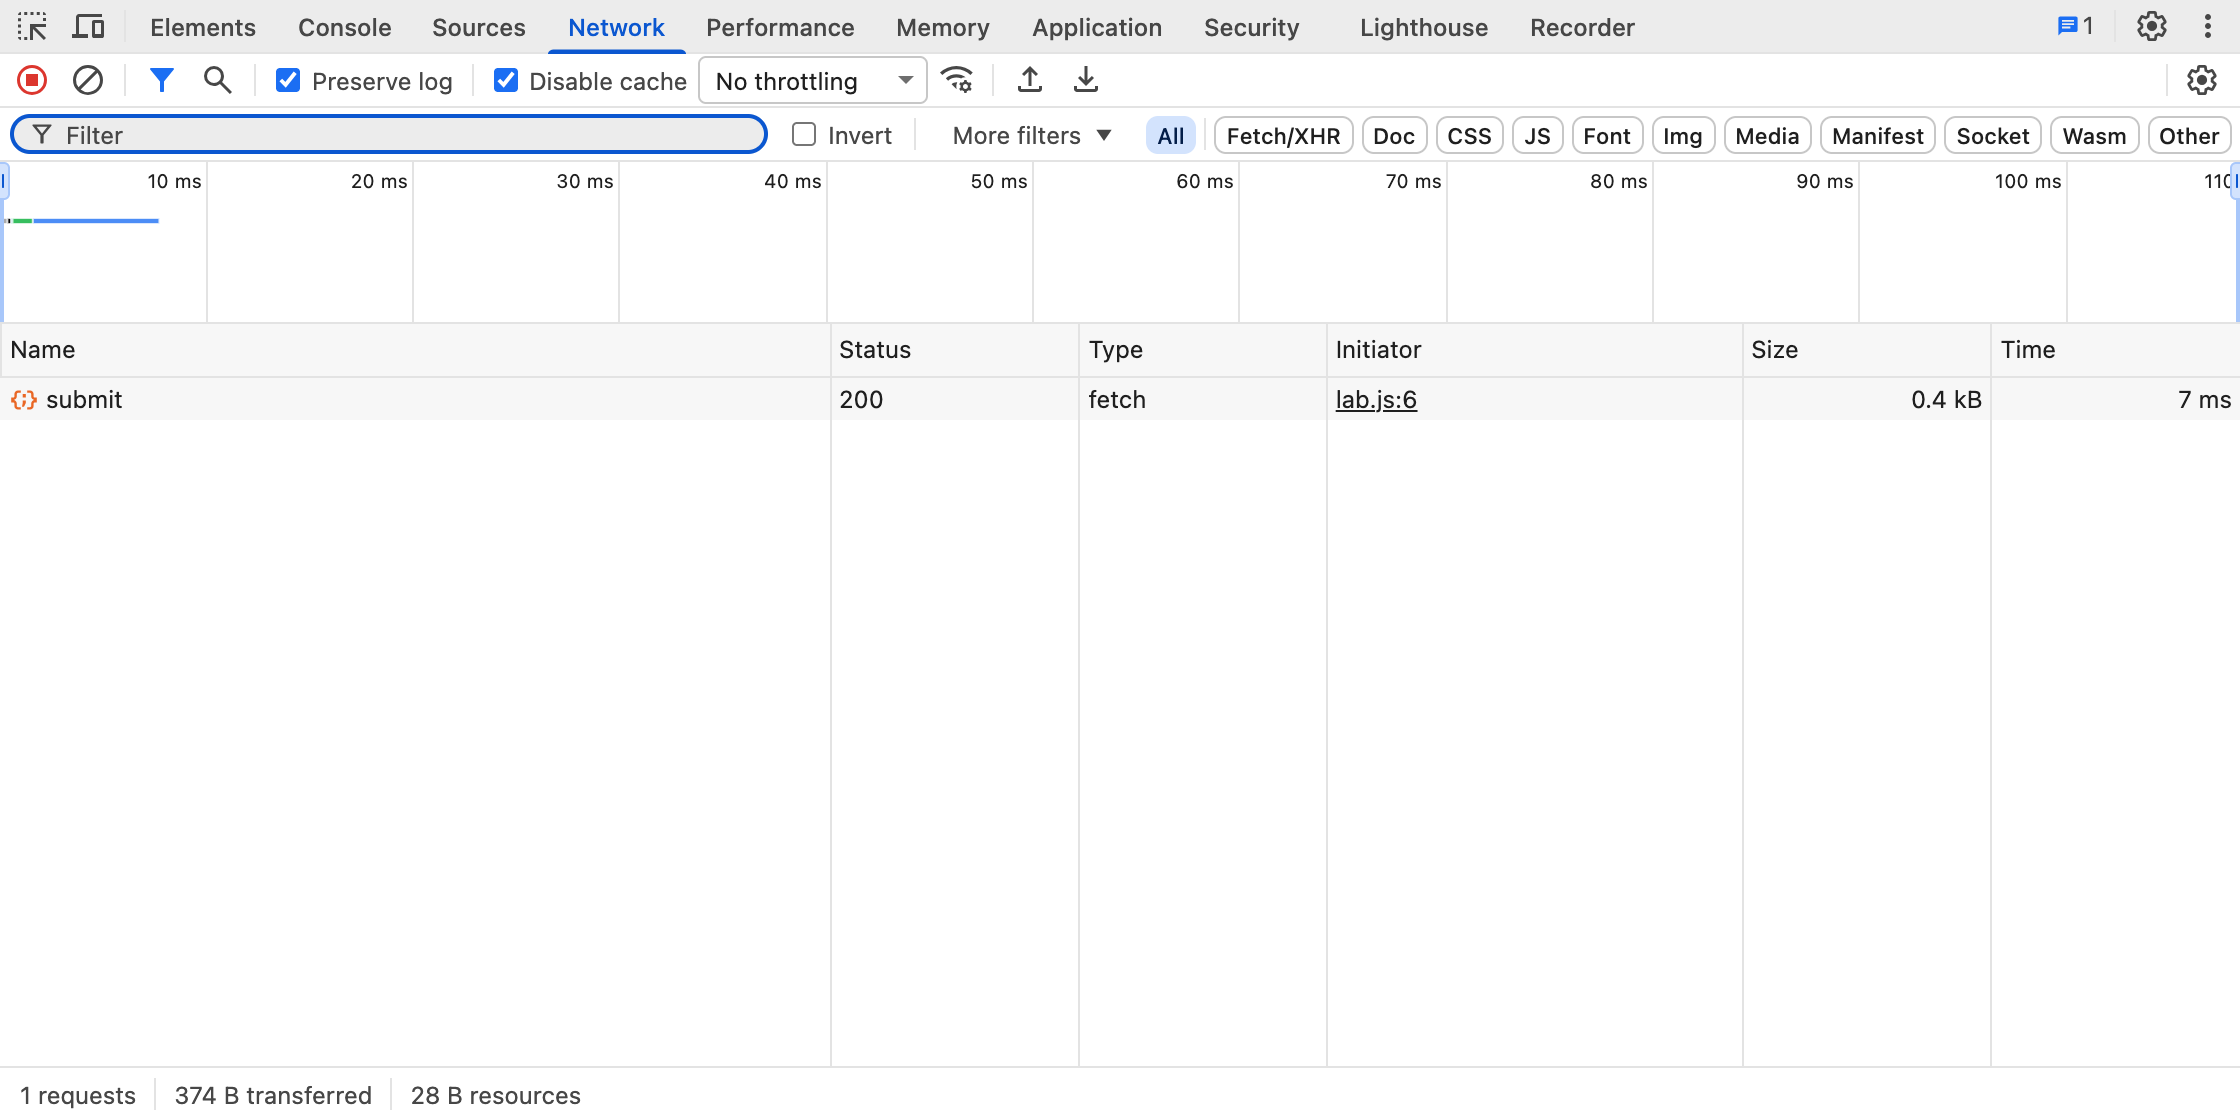 Open Full Size
Declining optional measurement did not stop the form from reaching its intended receiver. On any site, compare the remaining requests with what the privacy choice says it controls. The demonstration capture record contains the dummy request bodies and screenshot descriptions for this comparison.
Save a useful, safe record
Record the page URL, date, browser version, privacy choices, extensions or blockers, dummy marker, and exact actions. For each finding, write down the destination, outgoing field, timing, and request status.
This simple worksheet keeps your conclusion tied to what you inspected:
| Action | Destination | Data observed | When | Result |
|---|---|---|---|---|
| Type dummy email | Record the actual host | Record the field name and dummy value | Before submit / on submit / later | Responded / failed / blocked |
| Select test file | Record the actual host | Filename / file bytes / metadata / unresolved | Before processing / during / later | Responded / failed / blocked |
You can keep screenshots or export the Network log as a HAR, a structured record of requests. Save evidence locally first. Chrome's sanitized HAR export omits Cookie, Set-Cookie, and Authorization headers, but query parameters and body contents may still be sensitive. Inspect any capture before sharing it; a screenshot can reveal secrets too.
A negative finding also needs a scope: “I did not find the marker in the outgoing requests I inspected during these actions.” It does not certify the whole website, browser, device, or future behavior. When a payload cannot be interpreted or a connection was not captured, include that gap in your notes.
You can now apply the same procedure to a tool's own privacy claim, including ours.
Inspect LeetTools with the same method
We welcome you to check LeetTools with DevTools. We commit to building safe tools: inputs to tools labeled as processing locally stay in your browser, we keep those inputs out of our analytics and advertising integrations, and we explain deliberate external requests. Here is one way to check that commitment.
For a file-processing example:
- Open Image Converter, start recording All requests, and reload before choosing a file.
- Add a harmless PNG named
audit_probe_K4M8.png, choose WebP, press Convert Images, and download the result. Inspect traffic after selection, conversion, download, a short wait, and navigation. - Inspect outgoing URLs, headers, and bodies for the filename, image data, or derived information. The converter reads and converts the image in your browser; source images and generated output are not sent to LeetTools for processing. Distinguish resource downloads and local previews from requests carrying your data.
You can repeat the test with a dummy HAR in HAR Sanitizer. It reads and redacts the capture locally. Use invented credentials, inspect requests during opening and downloading, and check the downloaded HAR itself for remaining sensitive data.
Some network traffic is expected. Production pages load Google Analytics, and article pages may load advertising. Topic pages, the articles index, and tool pages do not load the advertising script. These services can receive page and browser information. Browser Region Auditor deliberately contacts external services for its checks. Read the privacy disclosure and examine the actual fields rather than assuming every request contains your file—or that local processing means an absence of tracking.
If you find behavior that breaks these promises, we welcome you calling it out publicly. Include the page, action, browser version, destination, and a redacted example so others can repeat the check. You can also reach us through our contact page.
If you trust LeetTools and our tools have helped you, please share the site with others who might find it useful.
Sources
Related guides
How-to
How to Share a HAR File Without Leaking Tokens
Chrome’s default HAR export already drops Cookie and Authorization. Query tokens such as access_token and password fields in JSON can remain. Compare Chrome, Firefox, and a local sanitizer.
Read guideHow-to
How to Batch Convert Images to WebP
Batch convert PNG, JPEG, WebP, and AVIF images to WebP with shared batch settings. Adjust quality or maximum dimensions, then download files or one ZIP.
Read guideHow-to
How to Combine Screenshots Into One Image
Combine screenshots horizontally, vertically, or in a grid. Set spacing and image scale, choose export bounds, and save one PNG, JPEG, or WebP.
Read guideHow-to
How to Convert WebP to PNG Without Uploading
Convert still WebP images to PNG, retain transparency, and optionally resize a batch. Compare browser conversion, desktop editors, and dwebp commands.
Read guide